Recent Projects
My Portfolio
These are some recent projects that I have collaborated with other to complete. We used many different tools and techniques to bring information and design to communities that haven't received them previously.
 +
+
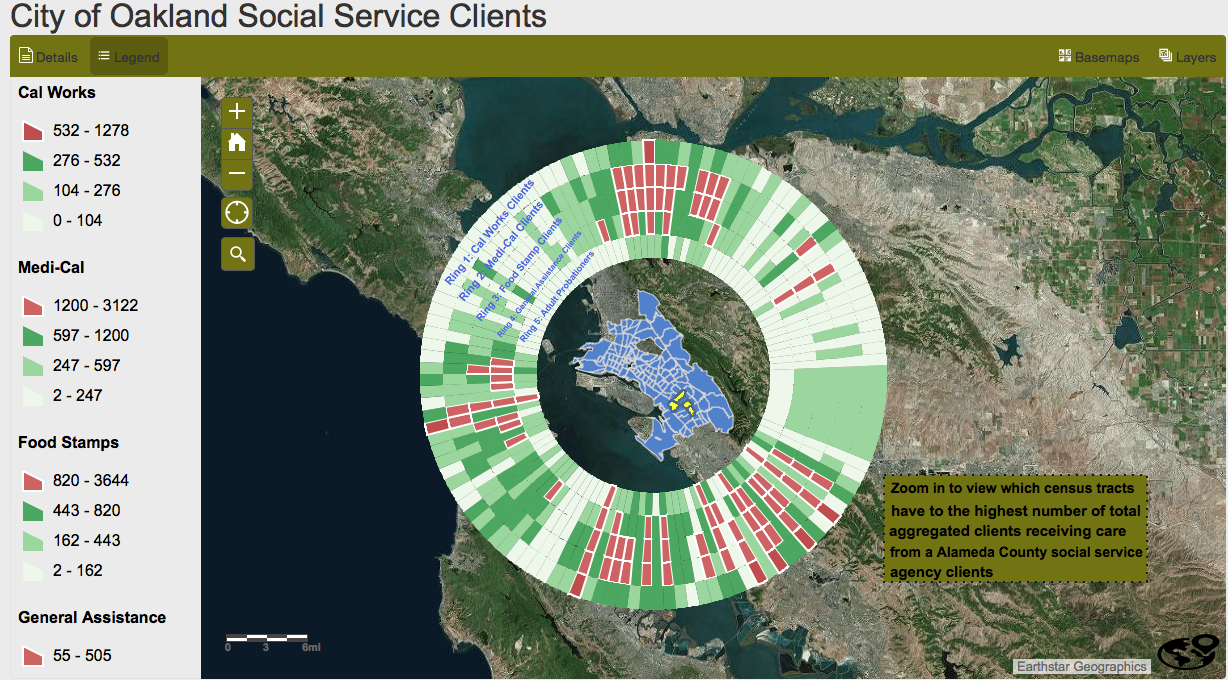
Oakland Ring Map
Click Image for Interactive Map
See Full Report / See Full Map Project Summary: This project was designed with the explicit purpose of developing a method to show the different concentrations of the social service clients in the City of Oakland. The ability to display a number of variables into one comprehensive map has troubled geographic scientists for decades. Using a ring technique we were able to present all of the information in a single map, which is easy for the audience to meaningfully interpret. See Full Report / See Full Map
× +
+
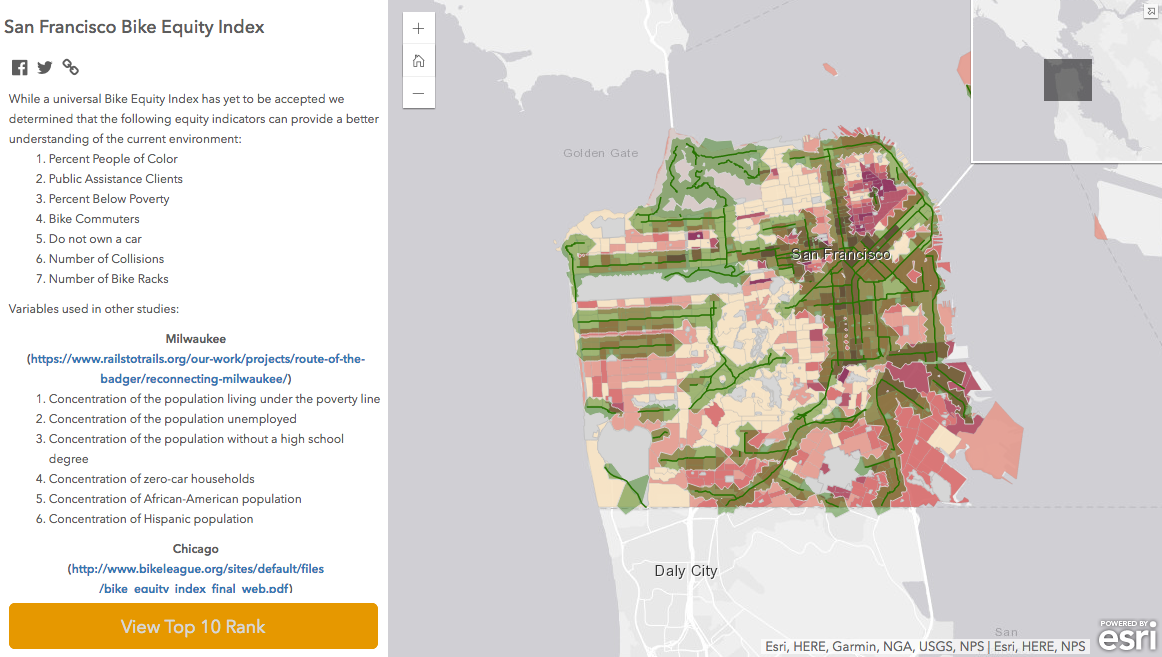
Bike Equity Index
Click Image for Interactive Map
See Full Report / See Full Map Project Summary: In order to find existing inequalities in biking infrastructure I build a model that provides insight into the geographic distribution. This will help inform policy makers as they determine how to invest the increased funding for bicycle infrastructure and hopefully guide them away from amplifying the current uneven outcomes. See Full Report / See Full Map
× +
+
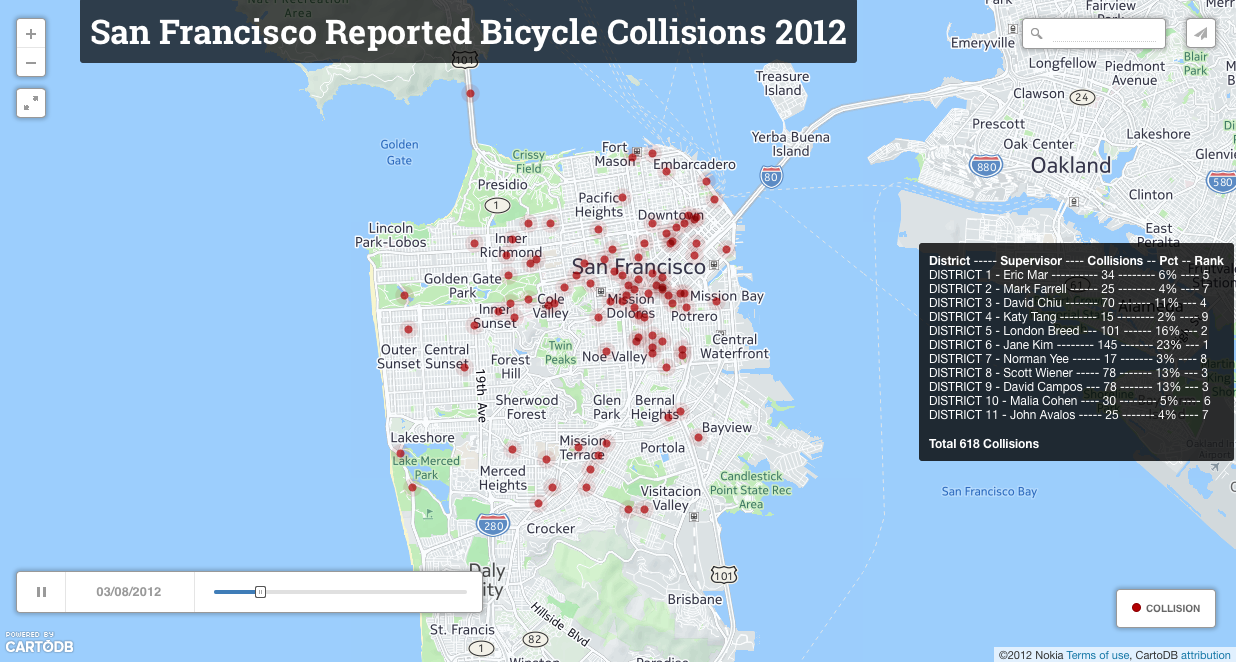
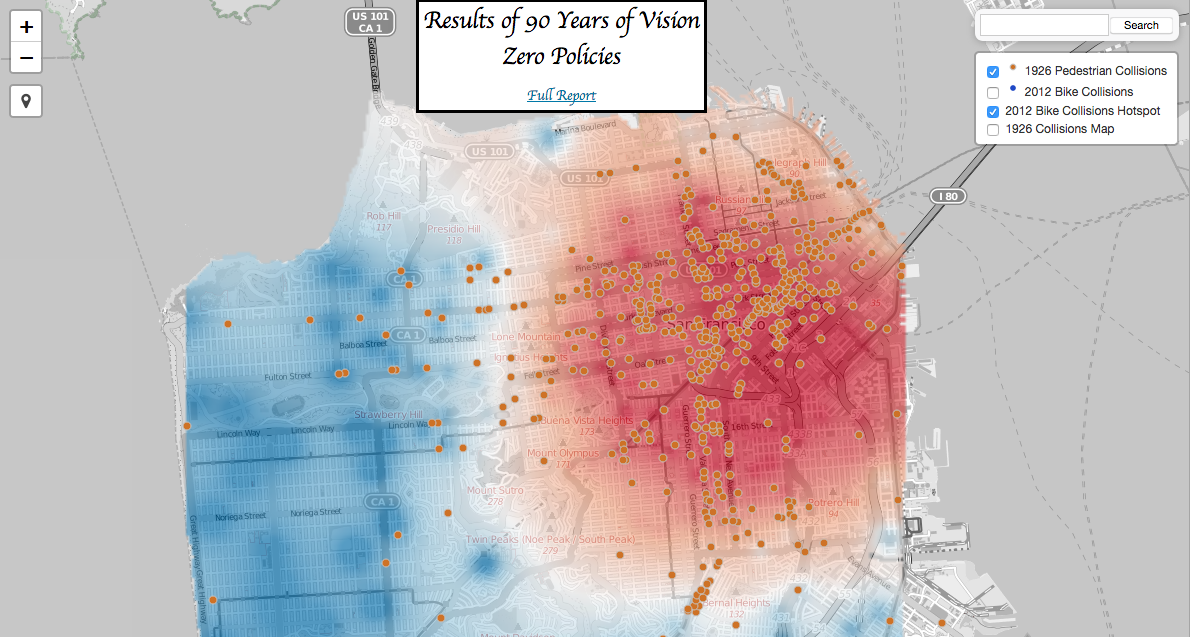
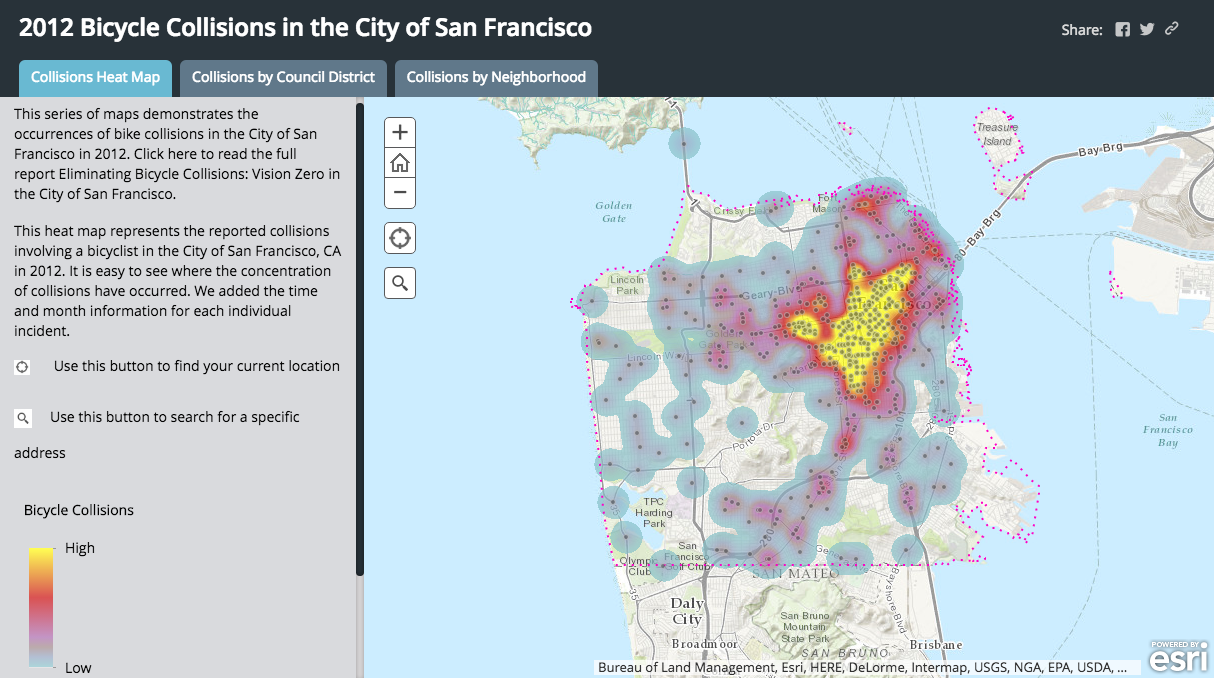
SF Bike Collisions
Click Image for Interactive Map
See Full Report / See Full Map
Project Summary: In an attempt to reduce the 1.7 reported collisions per day involving a cyclist in the City of San Francisco, we developed this interactive map, in alignment with the city’s policy for eliminating collisions between motorist and cyclists, for cyclists to show them where the most reported collisions have occurred. They can take this information and change their behavior and patterns of cycling as a way to avoid the most dangerous locations.
In an attempt to reduce the 1.7 reported collisions per day involving a cyclist in the City of San Francisco, we developed this interactive map that can assist engineers, scientists, planners, politicians, and citizens design streets that are less confusing, hectic, and most significantly dangerous for those that try to negotiate them.
See Full Report / See Full Map
 +
+
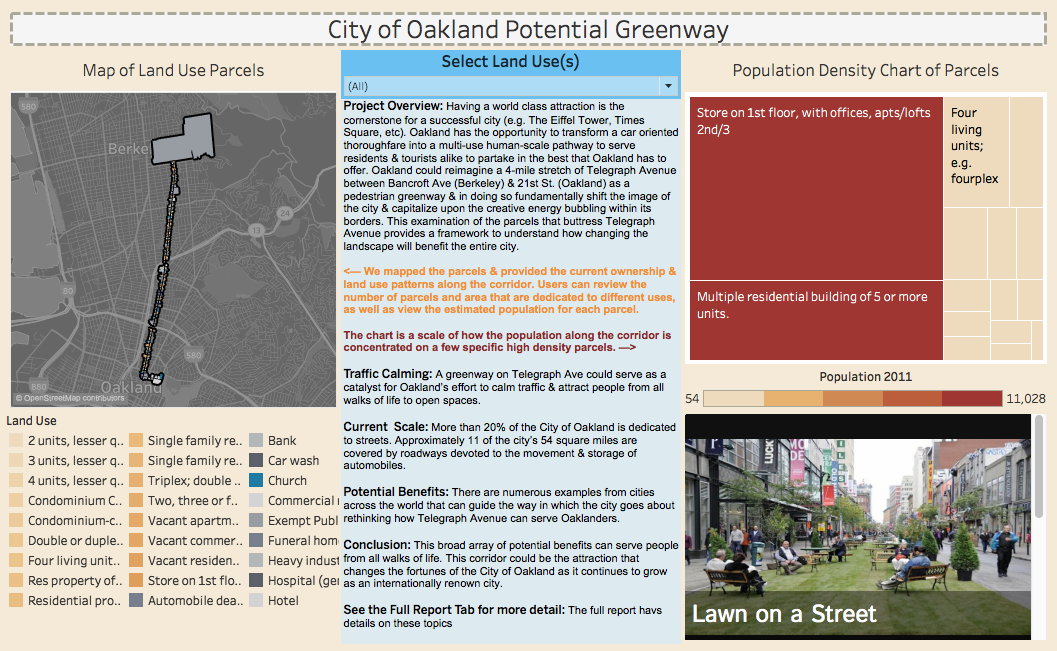
Oakland Greenway
Click Image for Interactive Dashboard
See Full Report / See Full Dashboard Project Summary: A Proposal to transform a carcentric boulevard into a world class attraction in the heart of Oakland. This examination looks at the land uses that buttress Broadway Avenue as a way to analyze the impact that could come from shutting down the street to car traffic and opening up the corridor to multiple modes of transit and more retail space. See Full Report / See Full Dashboard
× +
+
Vision Zero
Click Image for Interactive Map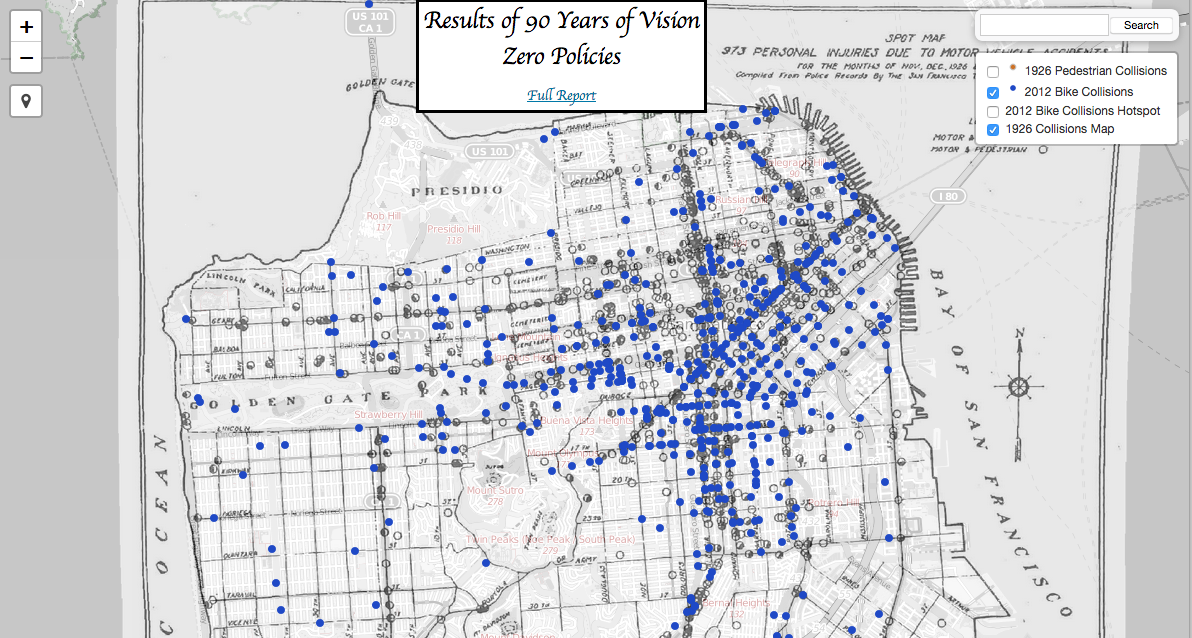
Read Full Report / See Full Map Project Summary: Vision Zero has become the new sensation for street safety advocates, but is it a new concept? In 1826, Dr. Miller McClintock surveyed the streets of San Francisco and came to some strikingly familiar recommendations to the ideals touted by today's modern Vision Zero champions. This report looks to see if we are just going to painfully continue to invest resources into the same recommendations or actually give teeth to the safe streets movement and provide the necessary resources to achieve the goal we all deserve. Read Full Report / See Full Map
× +
+
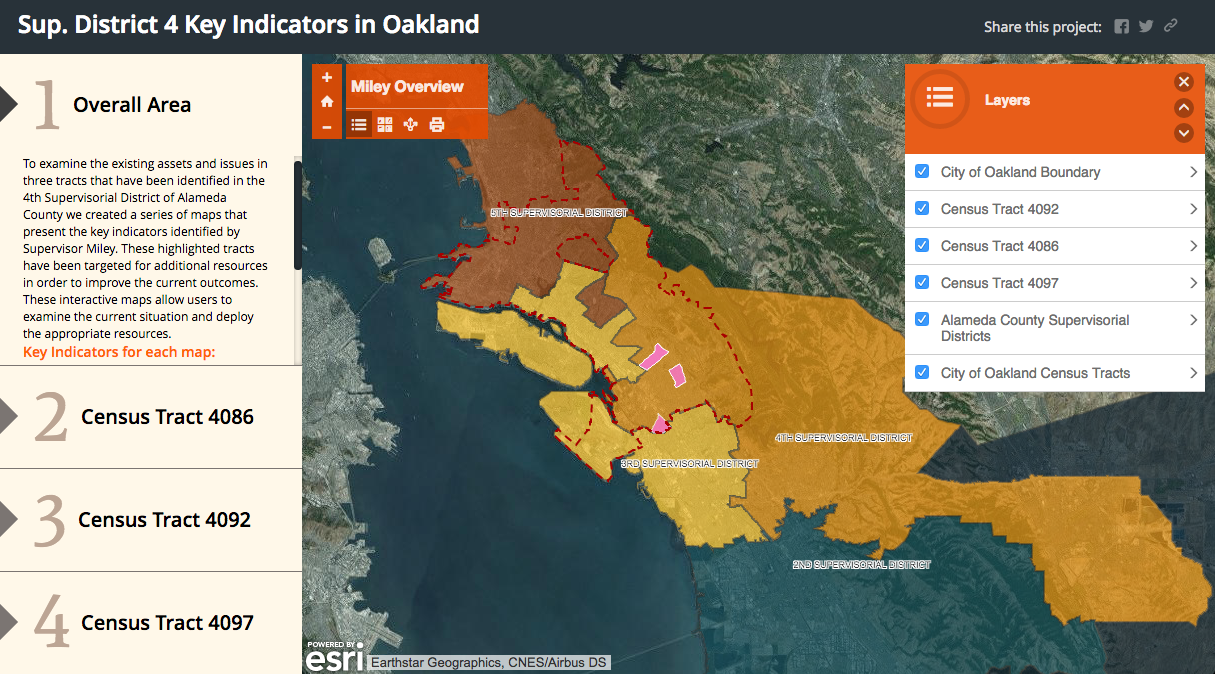
Miley Map
Click Image for Interactive Map
See Full Report / See Full Map
Project Summary: To examine the existing assets and issues in three tracts that have been identified in the 4th Supervisorial District of Alameda County we created a series of maps that present the key indicators identified by Supervisor Miley. These highlighted tracts have been targeted for additional resources in order to improve the current outcomes. These interactive maps allow users to examine the current situation and deploy the appropriate resources.
Key Indicators for each map:
∙ Churches
∙ Liquor Stores
∙ Major land owners
∙ Private Schools
∙ Public Schools
∙ Vacant Commercial
∙ Vacant Residential
∙ Violent crimes
See Full Report / See Full Map ×
 +
+
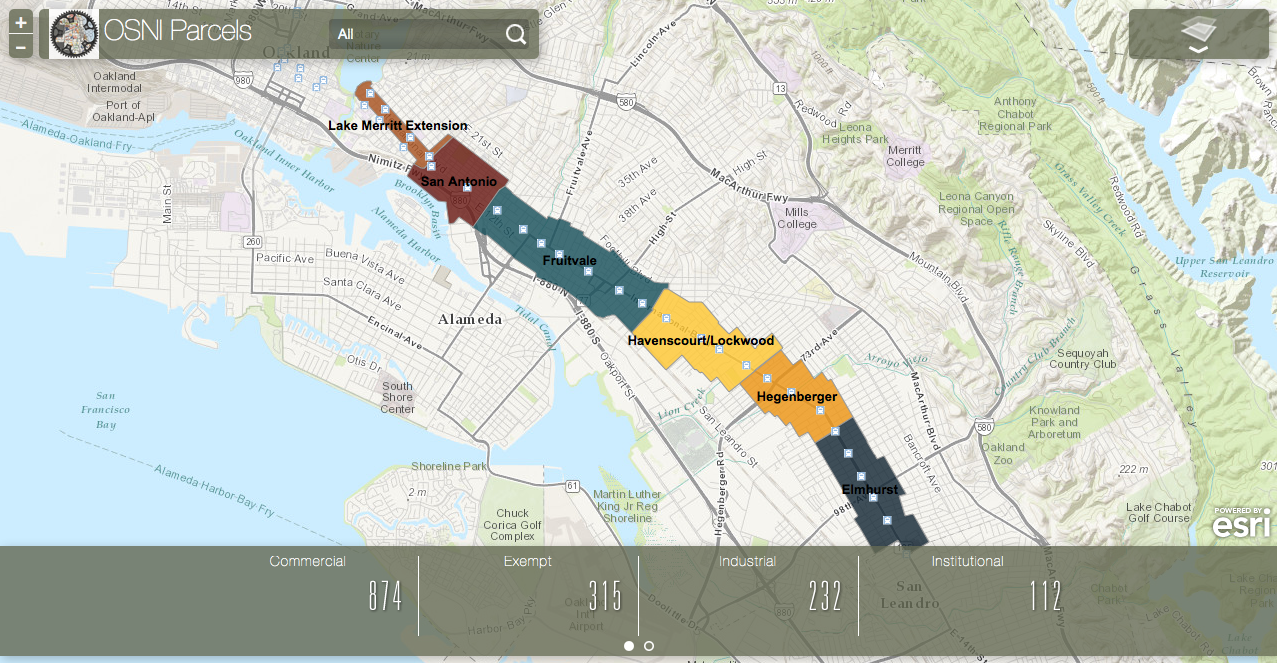
OSNI Map
Click Image for Interactive Map
Read Full Report / See Full Map Project Summary: This interactive map was designed to examine the potential impact of the Bus Rapid Transit Line (BRT) in East Oakland, CA. It was created for The Oakland Sustainable Neighborhood Initiative (OSNI), which was convened to examine the impact of the purposed BRT line along the International Boulevard, between Lake Merritt and 109th Avenue. This resource goes beyond the typical paper maps and allows the user to interact with the information and understand the different variables, such as, land use, ownership, and crime that capture some of the on-the-ground phenomenon. Read Full Report / See Full Map
× +
+
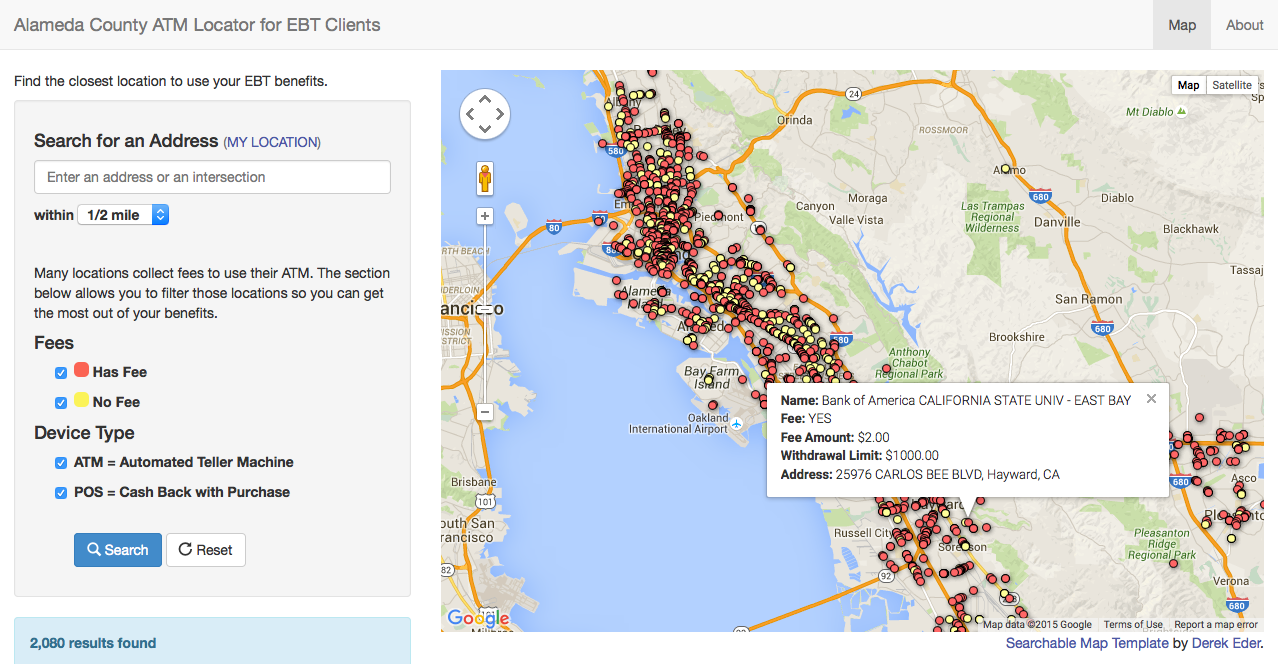
EBT Map
Click Image for Interactive Map
Read Full Report / See Full Map
Project Summary: Individuals and families on governmental assistance attempt to make every dollar that they are allocated stretch to freed clothes, and house their families.
CRC found that $19 million in the State of California of EBT resources was used on ATM fees.
Locally, Alameda County lost $60,000 in CalWorks funds a month ($720,000 in the year) to ATM fees. These funds could have benefited the local the local business that the clients frequent and not the banking system.
Read Full Report / See Full Map
 +
+
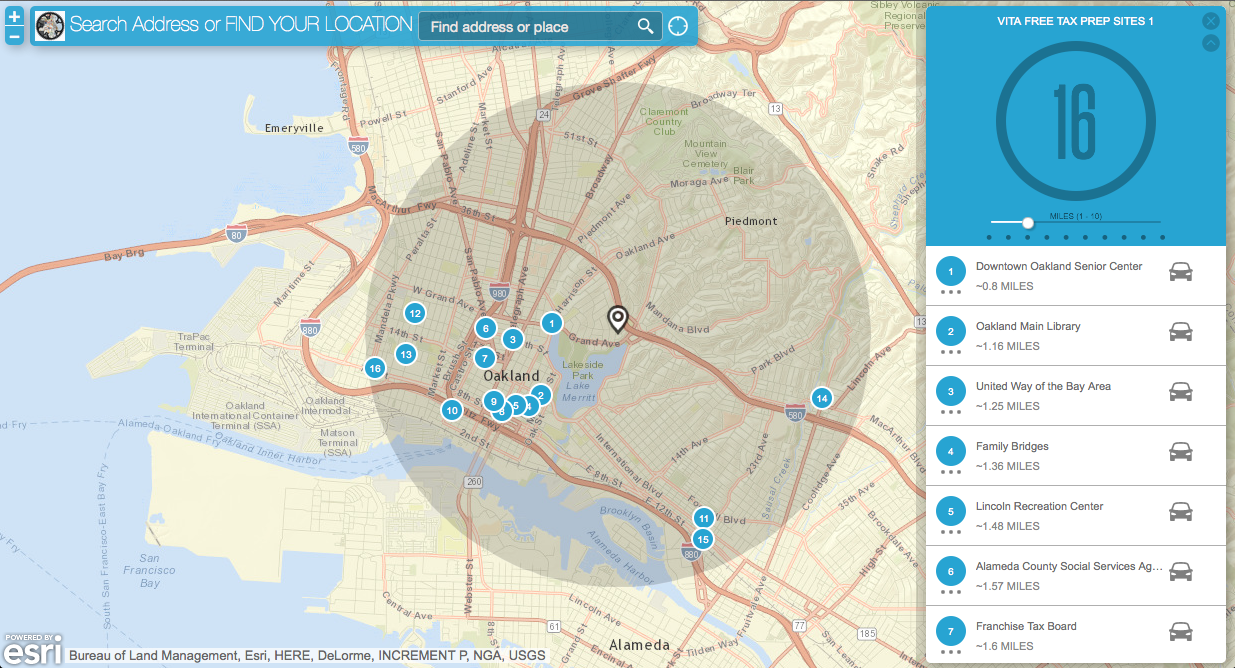
VITA/EITC Site Map
Click Image for Interactive Dashboard
Read Full Report / See Full Map Project Summary: The costs associated with private income tax preparation render them inaccessible to low-income individuals and families. We designed a map that allows tax payers in the City of Oakland to see the locations of where they can get their taxes prepared for free. The map was also developed to be easily embedded in website of any partnering organizations. Read Full Report / See Full Map
× +
+
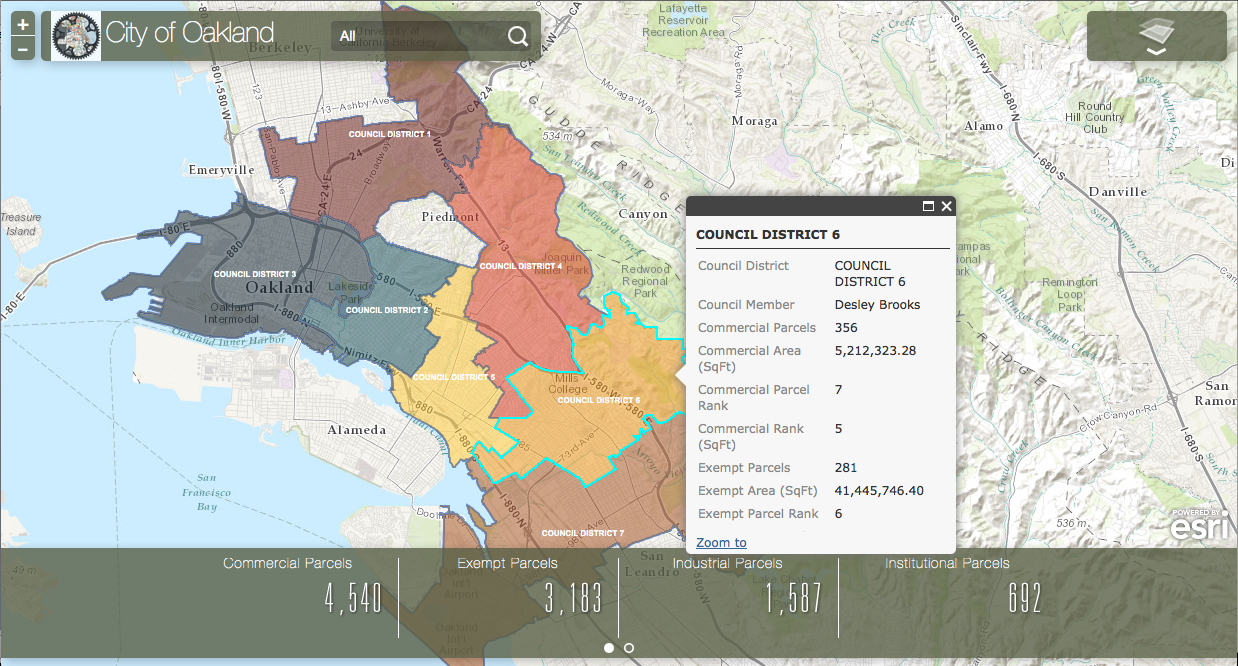
Oakland Land Use Map
Click Image for Interactive Map
Read Full Report / See Full Map Project Summary: City Council District representatives serve the residents in a specific geographic area. These geographies are drawn with different motivations, but the elected officials still have the responsibility to have the best interests of their constituents in mind in their decision making process. The interactive Oakland Land Use Map provides a tool for politicians, governmental agencies, and the public to examine the concentrations of land use types through the city. The map presents a count of parcels that have been assigned for the different types of land uses; Commercial, Exempt, Industrial, Institutional, Residential, Unknown, and Vacant parcels. Each district was ranked by the count and area dedicated to each land use type. A user can see the number of parcels for each use type at different zoom levels on the map. This map is a powerful tool and was designed for ease of use and understanding. Read Full Report / See Full Map
× +
+
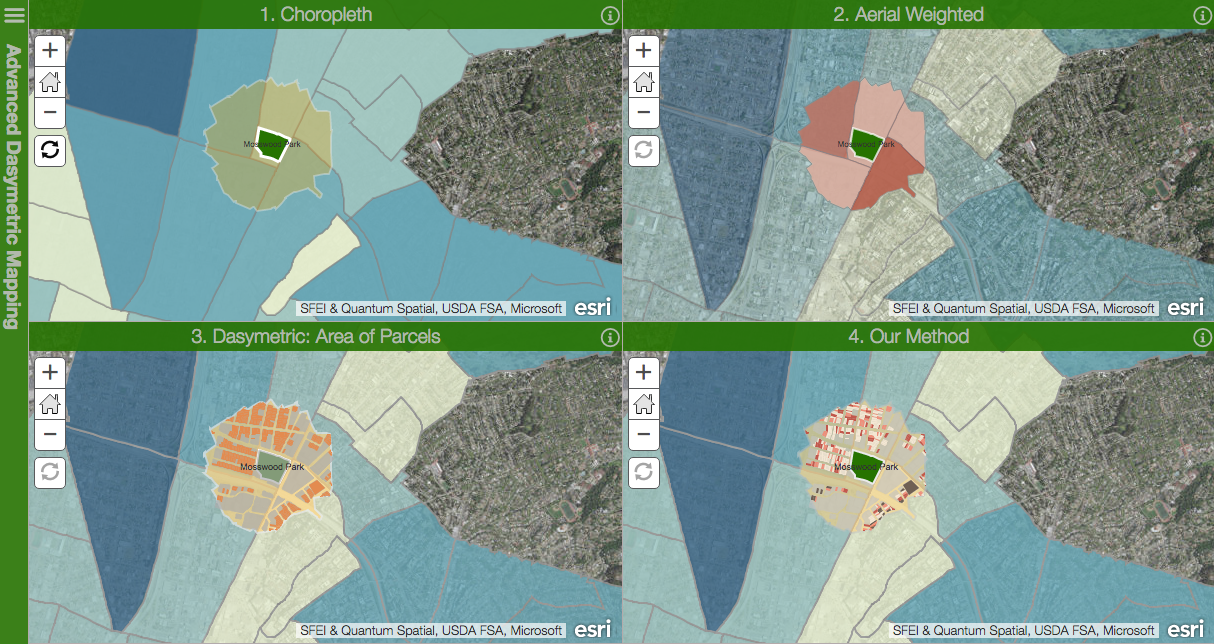
Mosswood Park Access
Click Image for Interactive Map
Read Full Report / See Full Map Project Summary: This is a side-by-side comparative view of four different population distribution models. Our Advanced Daysmetric Mapping Model is a 19-step process that we have shown to be a more accurate method to determine the population in custom geographic boundaries, such as, police beats, neighborhoods, and service areas. If you are interested in a more detailed version of this case study demonstrating the capabilities of the Advanced Dasymetric Mapping Model. Read Full Report / See Full Map
× +
+
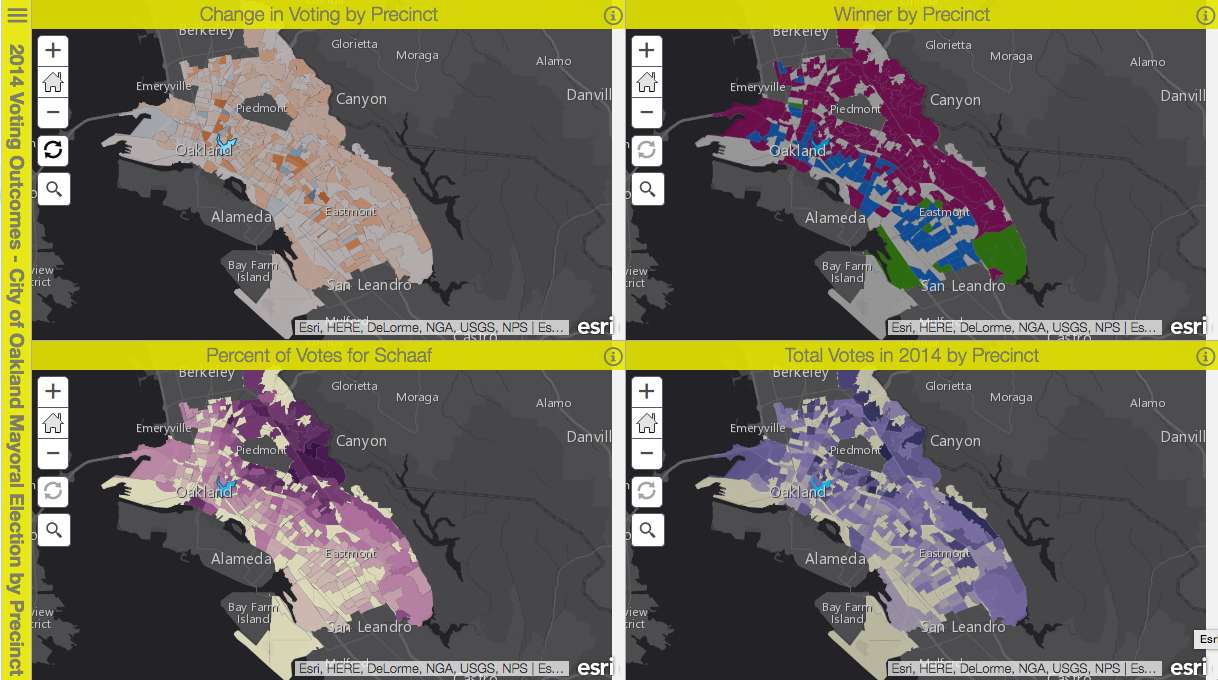
Oakland Voting Patterns
Click Image for Interactive Map
Read Full Report / See Full Map Project Summary: This is a comparative examination of the mayoral elections in the City of Oakland in the years 2010 and 2014. We looked at how the results of these elections ended up with a different public sentiment for each mayor. We used these elections as an example to examine what elections say about the voting public and then recommend steps that can be taken to improve how elections are conducted in the United States without greatly increasing the cost of elections. See Full Report / See Full Map
× +
+
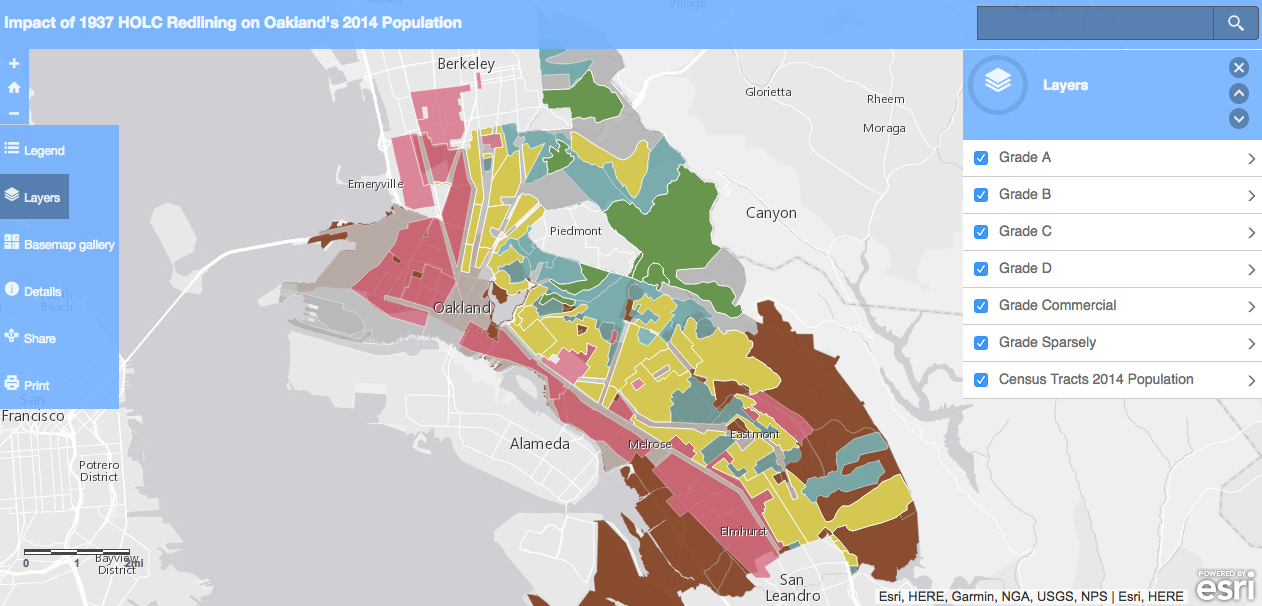
Impact of Redlining
Click Image for Interactive Map
Read Full Report / See Full Map Project Summary: A determination of the correlation between the 1937 Home Owners' Loan Corporation (HOLC) "Redlining" map and current housing and population patterns in the City of Oakland, CA. This project provides evidence for how the biased policies and programs of the past continue to have an impact on modern planning issues. Read Full Report / See Full Map
× +
+
OSNI Map
Click Image for Interactive Dashboard
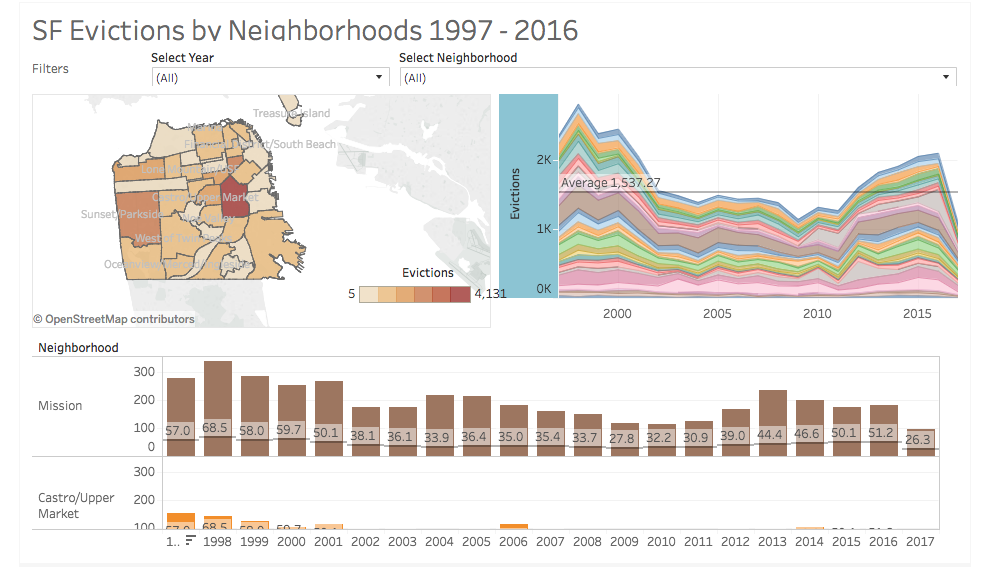
See Full Report / Full Dashboard Project Summary: This dashboard summaries 20 years of eviction data. The dashboard provides a data viz for the 5.5 units that were cleared of their occupants on a daily basis in San Francisco. This viz is intended to give context to the major issue facing individuals and families as they try to identify any patterns in the use of evictions and neighborhood conversion and surprisingly concludes that there isn’t a definitive relationship between the percent of household income dedicated to rent and the number of evictions. In other words, the more of people’s income is pent on rent doesn’t increase the eviction rate. See Full Report / Full Dashboard
× +
+
OSNI Map
Click Image for Larger Map
Read Full Report / See Full Map
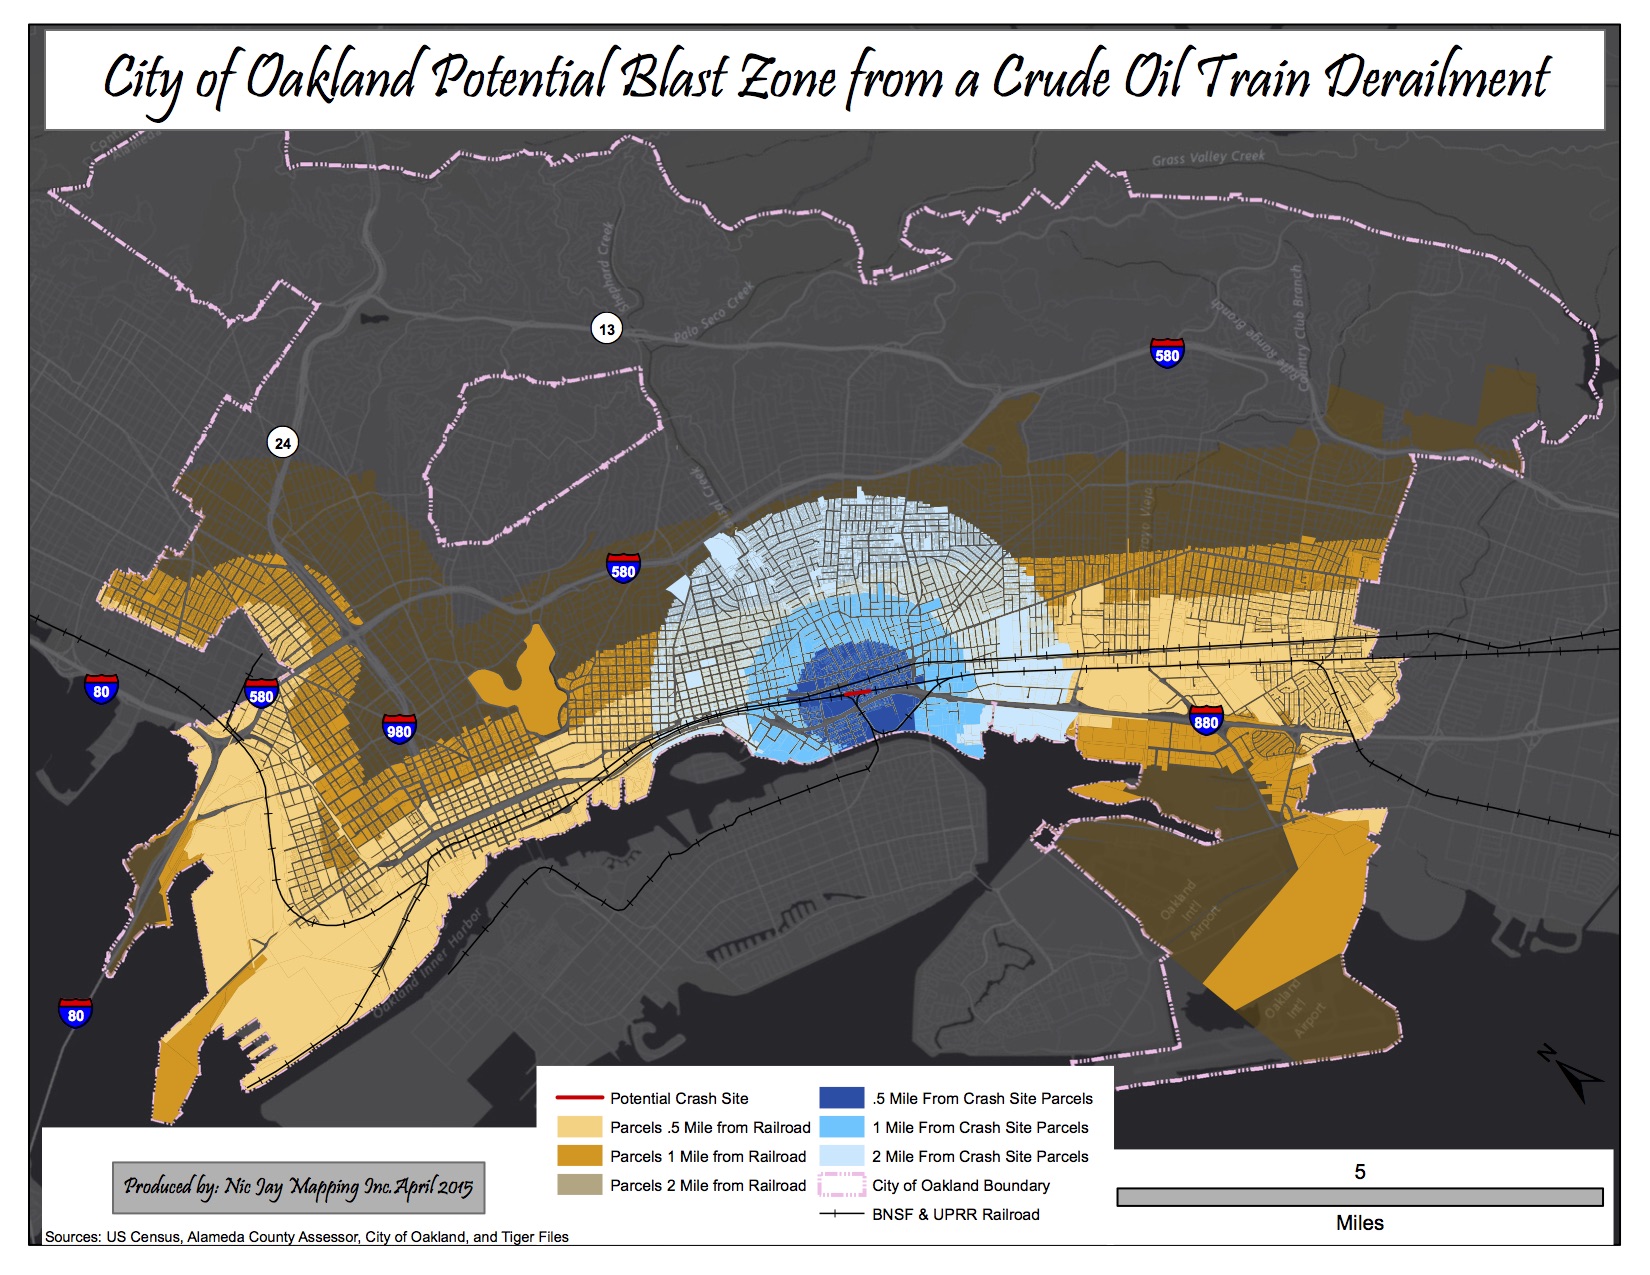
Project Summary: There is a current blind spot in the environmental justice movement. Even though it ensuring that all people in the USA enjoy the same degree of protection from both environmental and health hazards no matter what community they live, learn, worship, and work in is a cornerstone of the US Environmental Protection Agency (EPA), they have failed to respond to the major emerging environmental hazard of crude oil spills due to train derailment.
We analyzed the potential impact of a derailment of a train transporting oil in the City of Oakland, California. This project was designed to provide a clear impression to the governing bodies responsible for ensuring environmental justice, US EPA, California Environmental Potential Agency and local jurisdictional bodies, of the potential disaster in the City of Oakland.
We have created two maps that demonstrate the potential impact of the derailment of a train carrying oil through the City of Oakland California. The first map shows the areas that are vulnerable for the entire city, while the second map lays out a scenario of a theoretical derailment site.
Read Full Report / See Full Map
 +
+
SF Bike Collisions
Click Image for Interactive Map
Read Full Report / See Full Map Project Summary: Vision Zero plans to eliminate collisions between motorist and cyclist. This series of maps was intended for policymakers as they examine different policies to address this challenge. The maps create for this project provide different context in which these incidents happen, first a heatmap demonstrates the concentrations of reported collisions involving cyclists and then the subsequent maps isolate the collisions iby city council district and neighborhood geographies with comparative rankings. Read Full Report / See Full Map
× +
+
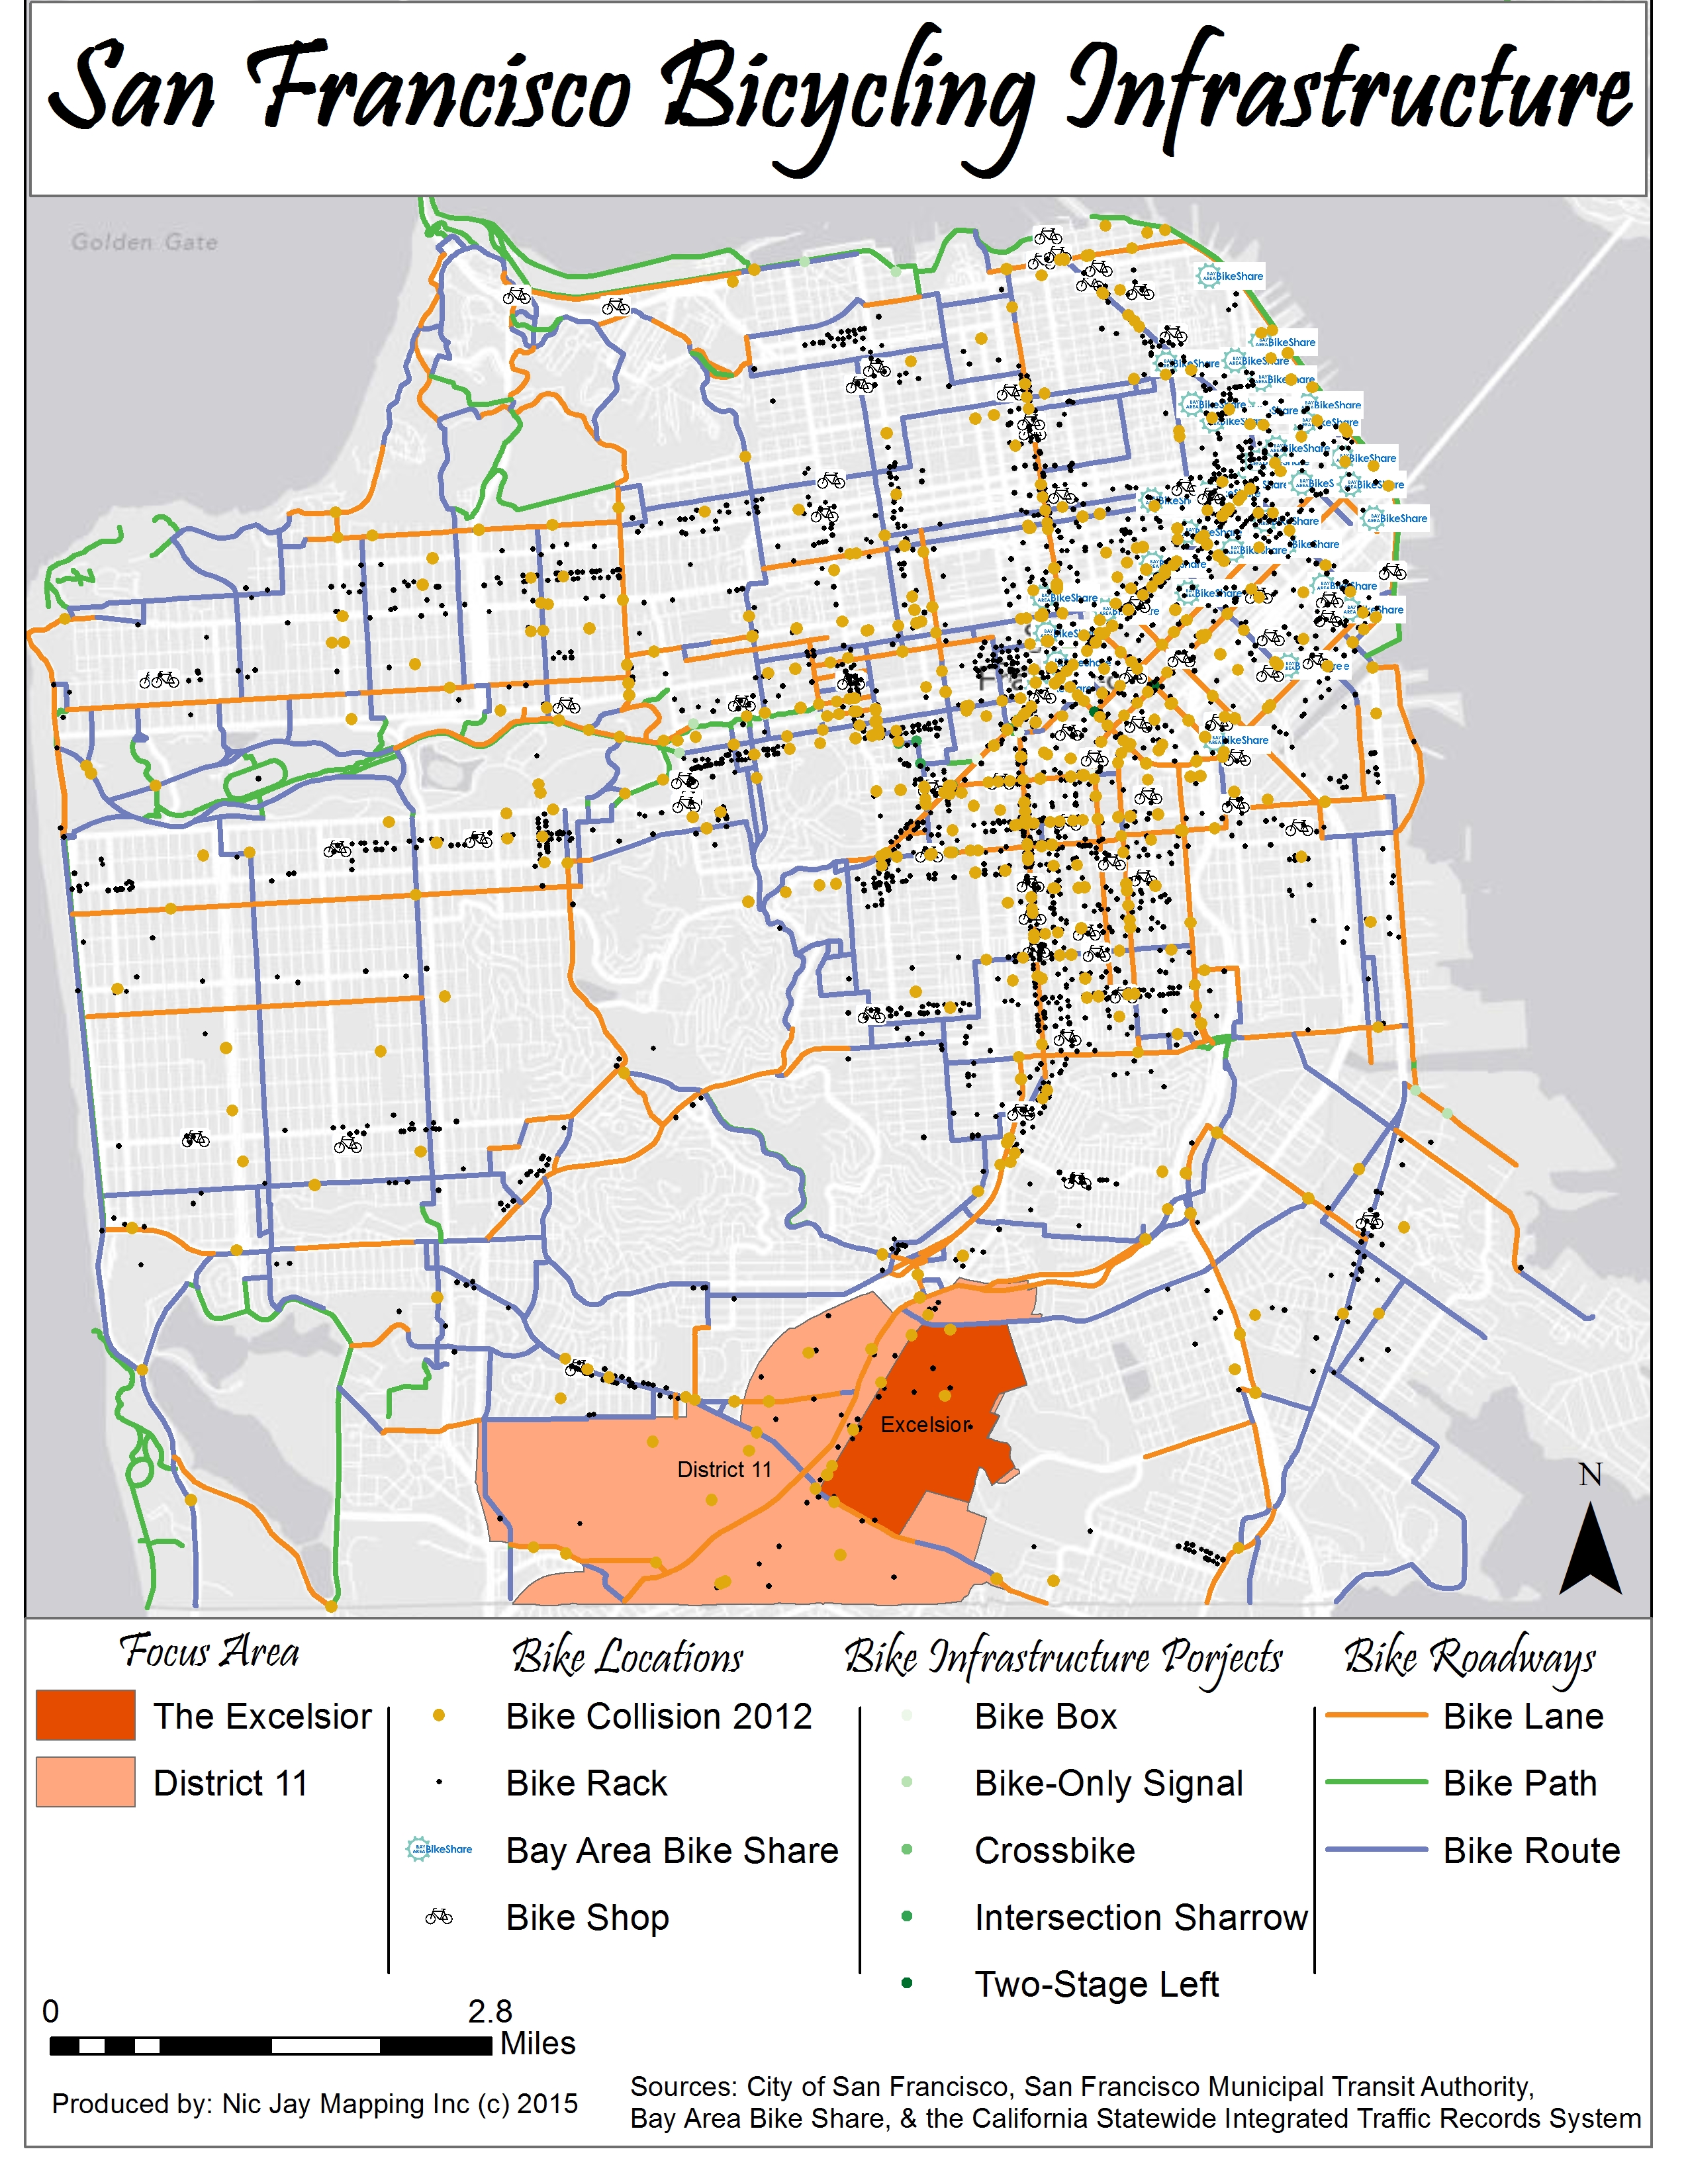
SF Bike Infrastructure
Click Image for Large Map
Read Full DRAFT Report / See Full Map
Project Details:
Project Summary: Bicycling is an inexpensive mode of transportation, however in a biking mecca like San Francisco the question arises if the bike resources are equitably distributed throughout the city.Bicis Del Pueblo, a bike start-up co-operative bike shop based in the Excelsior neighborhood, views the inability to address the biking issues in District 11 and the Excelsior neighborhood as evidence they have not been committed to building transportation equity. Bicis Del Pueblo will demonstrate, through the most current available data, how the City government has ignored the communities we serve as they allocate financial and material investments for bike infrastructure throughout the City.
The data shows the City has yet to make an equitable investment in District 11 or the Excelsior neighborhood as it pertains to bike parking, racks, lanes, paths, routes, share stations, and other infrastructure projects. Even as the entire City has been categorized by Bike Score as very bikeable, with many areas as a biker’s paradise, our service area have a substantially lower score because of the lack of existing infrastructure. This decision by the City to exclude our communities has an impact on the specific people living in our service area. See Full DRAFT Report / See Full Map ×
 +
+
Bicis Del Pueblo
Full Site
Bringing Bicycles to an underserved community
Project Summary: Bicis Del Pueblo is a project that teaches both youth and adults bicycle mechanics and safe fun uses for bike in the Excelsior district of San Francisco.This site allows Bicis to reach a wider audience and serves as the platform for the organizational inventory system. Full Site
× +
+
Community Well Website
Full Site
Project Summary: Resdesigned the site for Community Well which is a holistic health services resource for individuals, couple, and families of all backgrounds in the Excelsior District. They Community Well is a multifaceted, non-hierarchical organization offering compassionate support, real-life education and skill-building.
As part of the resdesign I taught Community Well how to maintain thier own site. I supported this effort with redesigning their website and have an standing offer to assist any of their practitioners to design and teach them how to maintain thier own personal sites.
Full Site
 +
+
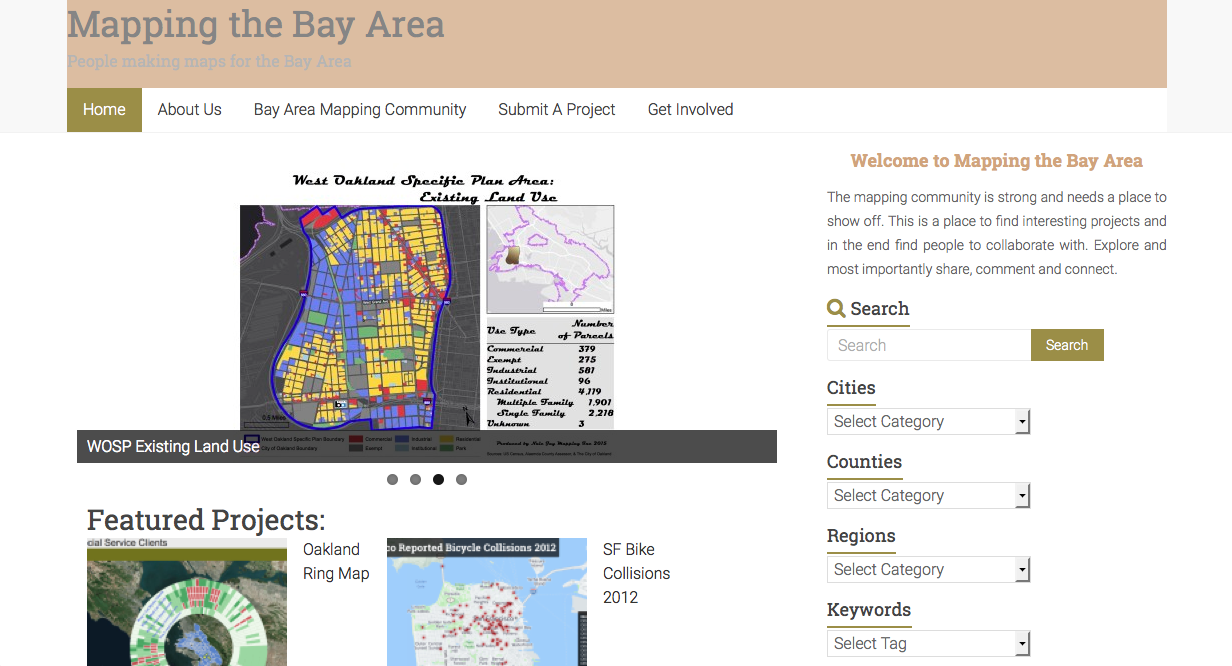
Mapping the Bay Area
Project Summary: Mapping the Bay Area believes that maps are unique tools, but too often are not widely distributed. They are typically made for a limited audience, a class, a policy project, a presentation, a conference, a book, or a community meeting. We believe that there is a potential for the mapping community to share their skills and projects with each other and push their presentations beyond small scale impact. Mapping the Bay Area is a platform for all cartographers to share their work and collaborate/inspire with others who have similar interests.
×